
(Stefan Gleason, Money Metals News Service) Gold and silver prices remain mired in weeks-long trading ranges. They are essentially moving sideways – for now.
Precious metals mining stocks, however, are moving up. The chart of the HUI gold miners index shows an uptrend in place since mid October.
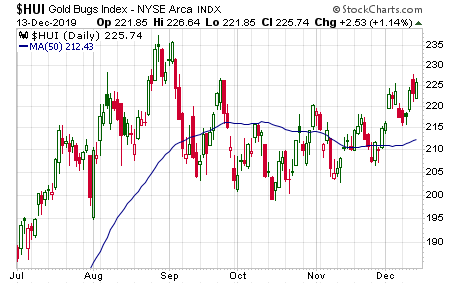
The HUI has traded above its 50-day moving average for several days in a row. The 50-day line itself is now also curling up, confirming underlying technical strength.
If the HUI is a leading indicator for spot gold (and it often is), then gold prices may be on the verge of also breaking out. Gold closed last Friday right at 50-day moving average resistance.
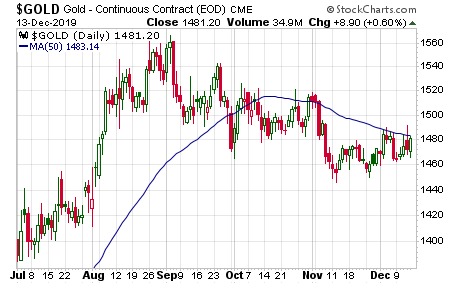
A couple strong closes above the 50-day line should put gold on a pathway to an extended rally.
Silver, meanwhile, has been trading around the $17.00/oz level for the past five weeks and needs to break above $17.30, then $17.50, to get something going on the upside.
Bulls can take encouragement in the impressive outperformance of the Silver Miners ETF (NYSE:SIL). It gained 4.5% last week to reach a three-month high. Another move of that magnitude this week would put SIL at a new high for the year – and give silver itself some catching up to do!
