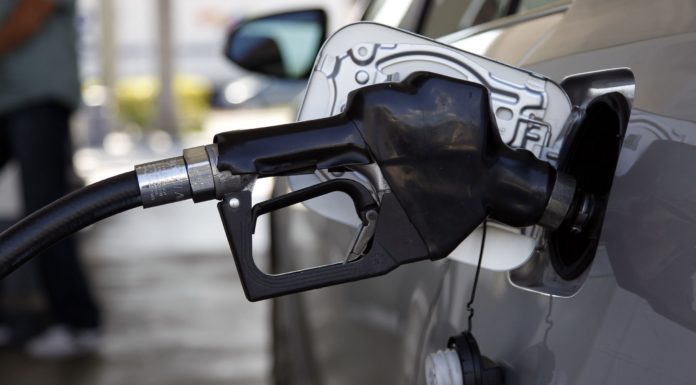
(The Center Square) Gas prices are hovering near all-time highs in the United States. The average price of a gallon of regular gasoline stood at $4.24 as of March 23 – up 70 cents from a month ago.
What Americans pay at the pump is subject to a number of factors – the most important of which is the price of crude oil, which is determined by global supply and demand. As major markets around the world have banned Russian oil imports amid the ongoing war in Ukraine, the global energy market has tightened considerably, sending gas prices to record highs.
While shocks to the global energy market are largely out of the control of U.S. policymakers, other factors affecting gas prices are not, namely taxes. The federal government levies a tax of 18.4 cents on every gallon of gas sold to American motorists.
On top of the federal gas tax, as of January 2022, California levied an additional tax of 68.2 cents per gallon – the highest gas tax among states. Currently, the average price of a gallon of gas in California stands at $5.88. Including the federal tax, taxes account for 14.7% of the average price of a gallon of gas in the state.
Gas taxes are typically used to fund road and highway repair projects to fix damage caused by usage and wear. In California, vehicle miles traveled per year total about 11,020 per driver, the 14th fewest among states.
Not only are taxes adding to the pain Americans are feeling at the pump, but the revenue they generate has failed to keep up with infrastructure maintenance costs and inflation. While many states are adjusting tax rates to address the shortfall, the federal gas tax has not changed since 1993.
All data on gas taxes are current as of Jan. 1, 2022 and are from the American Petroleum Institute. Data on the average price of a gallon of regular gas are for March 23, 2022 and are from AAA. Annual vehicle miles traveled per driver was calculated using data from the Federal Highway Administration.
| Rank | State | Taxes and fees (cents per gal.) | Avg. gas price ($ per gal.) | State and federal tax rate (%) |
|---|---|---|---|---|
| 1 | California | 68.2 | 5.88 | 14.7 |
| 2 | Illinois | 59.6 | 4.50 | 17.3 |
| 3 | Pennsylvania | 58.7 | 4.31 | 17.9 |
| 4 | Hawaii | 51.7 | 5.09 | 13.8 |
| 5 | New Jersey | 50.7 | 4.19 | 16.5 |
| 6 | Nevada | 50.5 | 5.16 | 13.4 |
| 7 | Indiana | 49.8 | 4.15 | 16.4 |
| 8 | Washington | 49.4 | 4.73 | 14.3 |
| 9 | New York | 48.2 | 4.36 | 15.3 |
| 10 | Michigan | 45.2 | 4.14 | 15.3 |
| 11 | Florida | 43.6 | 4.13 | 15.0 |
| 12 | Oregon | 38.8 | 4.71 | 12.1 |
| 13 | North Carolina | 38.8 | 4.07 | 14.1 |
| 14 | Ohio | 38.5 | 4.00 | 14.2 |
| 15 | Georgia | 37.6 | 4.03 | 13.9 |
| 16 | Maryland | 36.1 | 3.78 | 14.4 |
| 17 | Connecticut | 35.8 | 4.33 | 12.5 |
| 18 | West Virginia | 35.7 | 4.09 | 13.2 |
| 19 | Rhode Island | 35.0 | 4.22 | 12.6 |
| 20 | Virginia | 34.4 | 4.09 | 12.9 |
| 21 | Montana | 33.3 | 4.02 | 12.8 |
| 22 | Idaho | 33.0 | 4.37 | 11.8 |
| 23 | Wisconsin | 32.9 | 3.93 | 13.1 |
| 24 | Vermont | 32.1 | 4.20 | 12.0 |
| 25 | Utah | 31.9 | 4.41 | 11.4 |
| 26 | Alabama | 31.3 | 4.03 | 12.3 |
| 27 | Minnesota | 30.6 | 3.92 | 12.5 |
| 28 | Maine | 30.0 | 4.19 | 11.6 |
| 29 | South Dakota | 30.0 | 3.94 | 12.3 |
| 30 | Iowa | 30.0 | 3.87 | 12.5 |
| 31 | Tennessee | 27.4 | 4.03 | 11.4 |
| 32 | South Carolina | 26.8 | 3.95 | 11.4 |
| 33 | Massachusetts | 26.5 | 4.26 | 10.6 |
| 34 | Kentucky | 26.0 | 3.97 | 11.2 |
| 35 | Nebraska | 25.7 | 3.87 | 11.4 |
| 36 | Arkansas | 24.8 | 3.82 | 11.3 |
| 37 | Kansas | 24.0 | 3.77 | 11.3 |
| 38 | Wyoming | 24.0 | 4.05 | 10.5 |
| 39 | New Hampshire | 23.8 | 4.19 | 10.1 |
| 40 | North Dakota | 23.0 | 3.90 | 10.6 |
| 41 | Delaware | 23.0 | 4.01 | 10.3 |
| 42 | Colorado | 22.0 | 3.97 | 10.2 |
| 43 | Louisiana | 20.0 | 4.04 | 9.5 |
| 44 | Oklahoma | 20.0 | 3.79 | 10.1 |
| 45 | Texas | 20.0 | 3.90 | 9.9 |
| 46 | Missouri | 19.9 | 3.77 | 10.2 |
| 47 | Arizona | 19.0 | 4.63 | 8.1 |
| 48 | New Mexico | 18.9 | 4.14 | 9.0 |
| 49 | Mississippi | 18.8 | 3.93 | 9.5 |
| 50 | Alaska | 15.1 | 4.71 | 7.1 |


